Generally, when most of us think about a good time or a funny meme, it doesn’t have, say, an x and y axis or data labels. But it’s important to not limit yourself, the truth is that clever folks out there can make good content out of anything.
The “Funny Charts” online group is dedicated to amusing, creative, and informative graphs that attempt to mix data with humor. From helpful guides to assist in creating insults, to statistical breakdowns of Eminem’s songs, get comfortable as you scroll through, upvote your favorites, and be sure to share your thoughts in the comments section.
#1 How Kids Are Funny
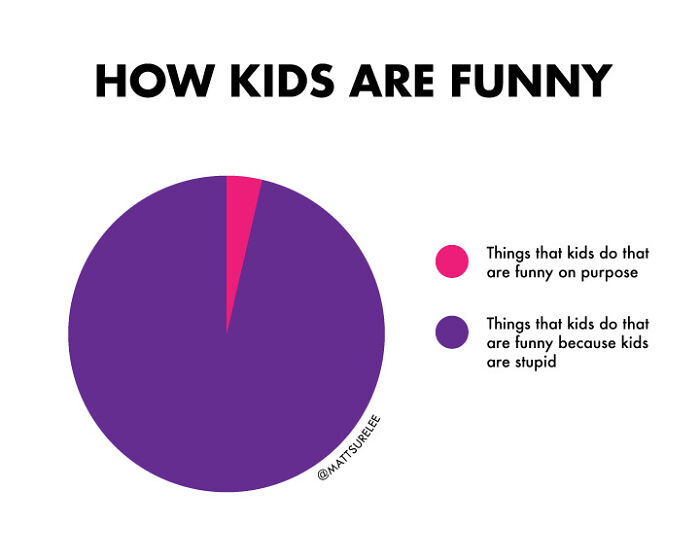
Image credits: matts41
#2 Insult Generator For Kids
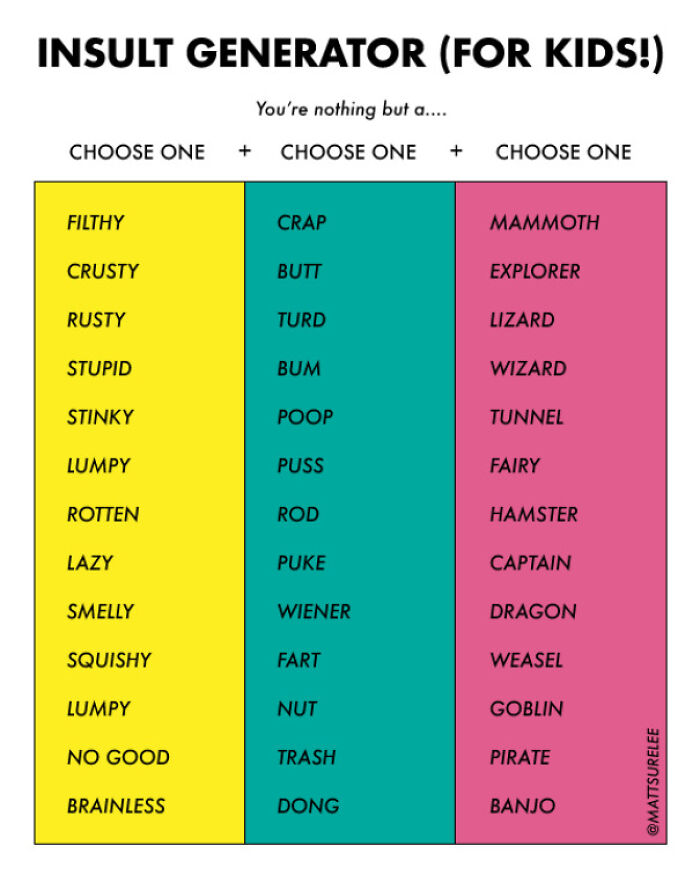
Image credits: matts41
#3 World’s Most Accurate Pie Chart
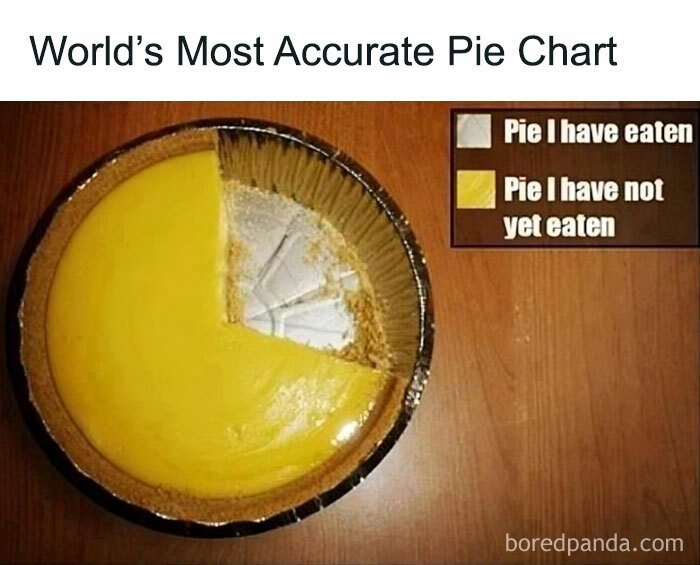
Image credits: matts41
Sitting at over fifteen thousand followers, the “Funny Charts” internet group is on an important mission to reclaim graphs from the clutches (and notoriety) of maths and economics. As is clearly on display here, a little creative spark can do wonders. Indeed, if you take a step back, it’s easy to see how the standard structure of memes actually fits pretty well.
After all, memes tend to use standard, recognized layouts to communicate the joke. This is just as true for graphs, which need to have certain attributes to even function. Despite their reputation as a dry, analytical tool, it’s worth giving graphs and charts a second chance. Indeed, unlike “raw” text, it’s a pretty visual way to showcase information.
#4 Thoughts During Yoga
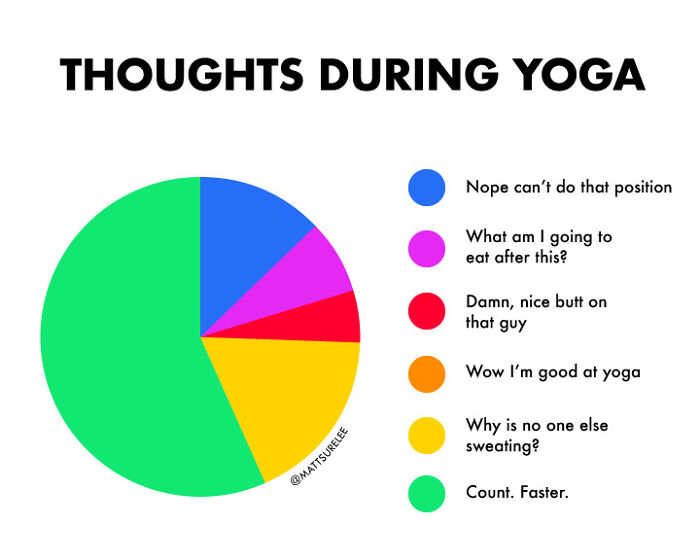
Image credits: matts41
#5 Are You Tired? Flowchart
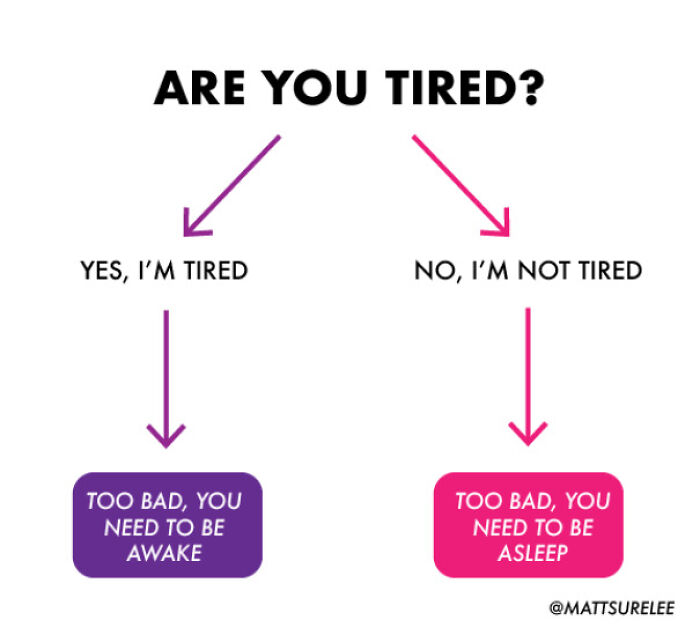
Image credits: matts41
#6 Eminem Lyrics
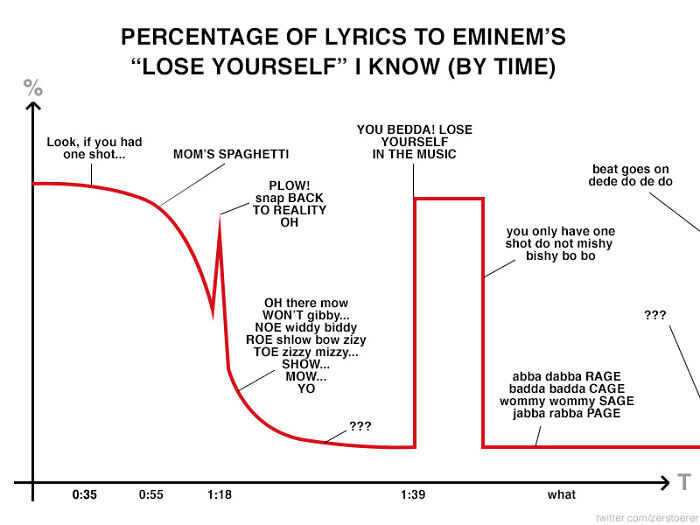
Image credits: oopsicharted
It’s not that hard to imagine more artistically inclined people being able to engage with data displayed this way. Research does suggest that visual indicators are actually pretty important in learning. You might say, well, a graph is just words and figures laid out on a matrix, not a paragraph, but it’s important to note that the visual layout is a key component in what we take away from this sort of information.
#7 How I Sleep
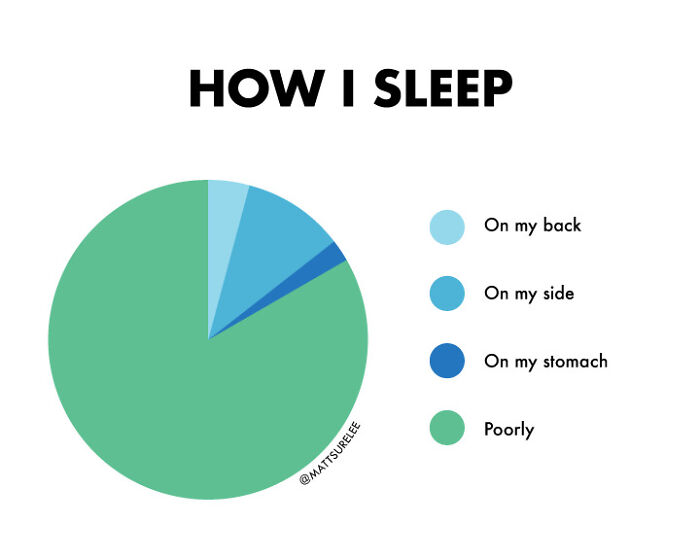
Image credits: matts41
#8 Cat’s Decision Tree
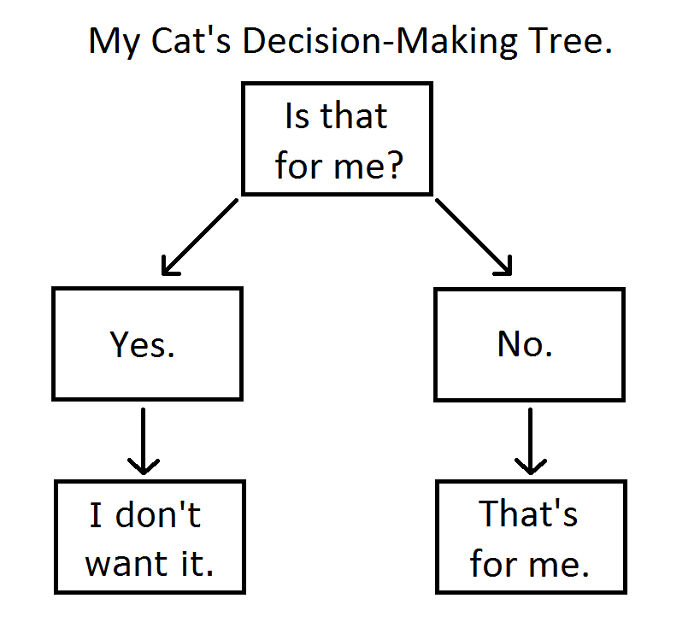
Image credits: matts41
#9 Presenting In A Meeting Timeline
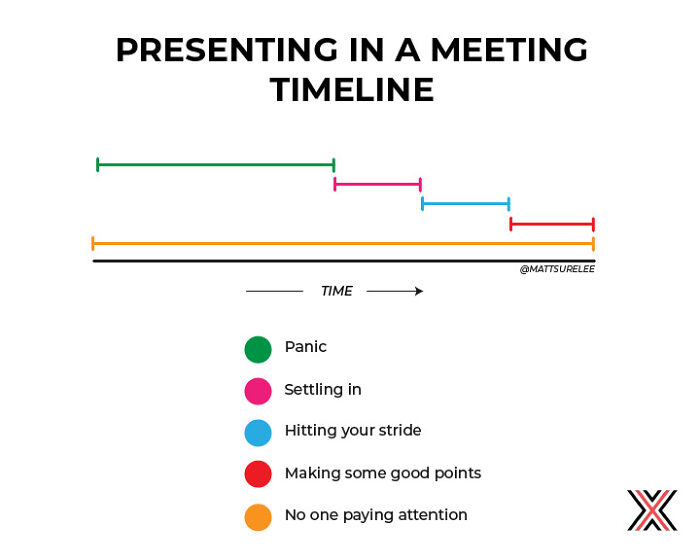
Image credits: matts41
This is all to say that it’s unfair to pigeonhole graphs and charts into the “boring” category. The items here are a clear indicator that it’s a lot more complex than that. So be sure to perhaps save the items here that you might find useful later. Even as a text-biased observer, I have to admit, that it’s a lot faster to glance at a chart than pursue a block of text.
#10 A Day At Work
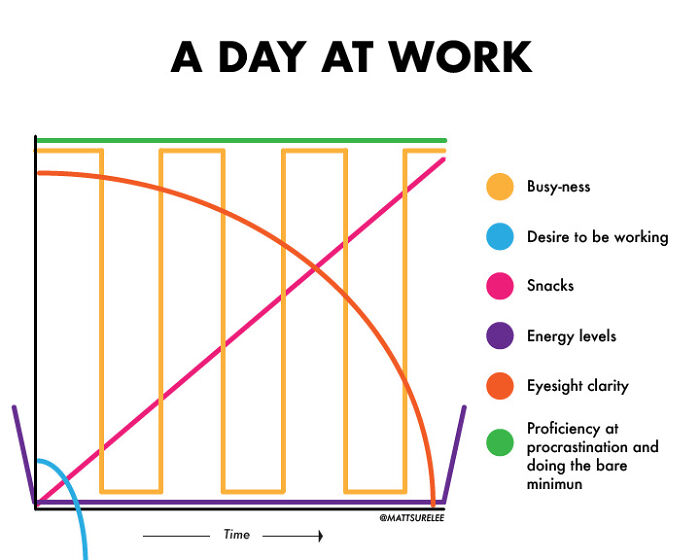
Image credits: matts41
#11 It’s Math
Image credits: matts41
#12 Believe
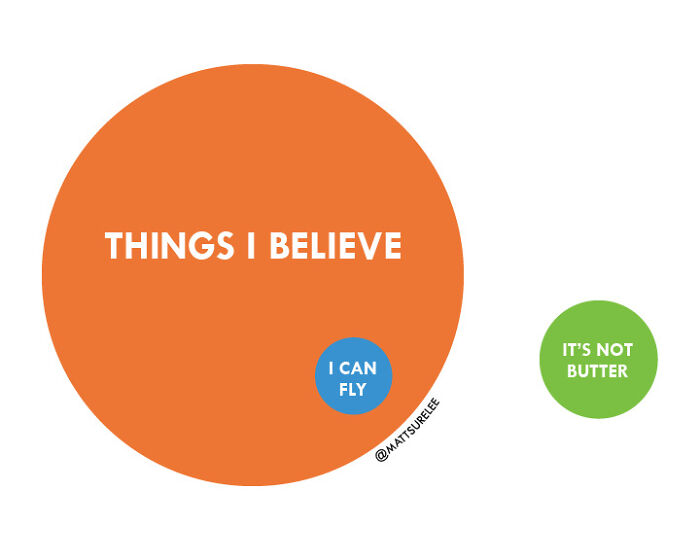
Image credits: matts41
#13 The Doctor Alphabet
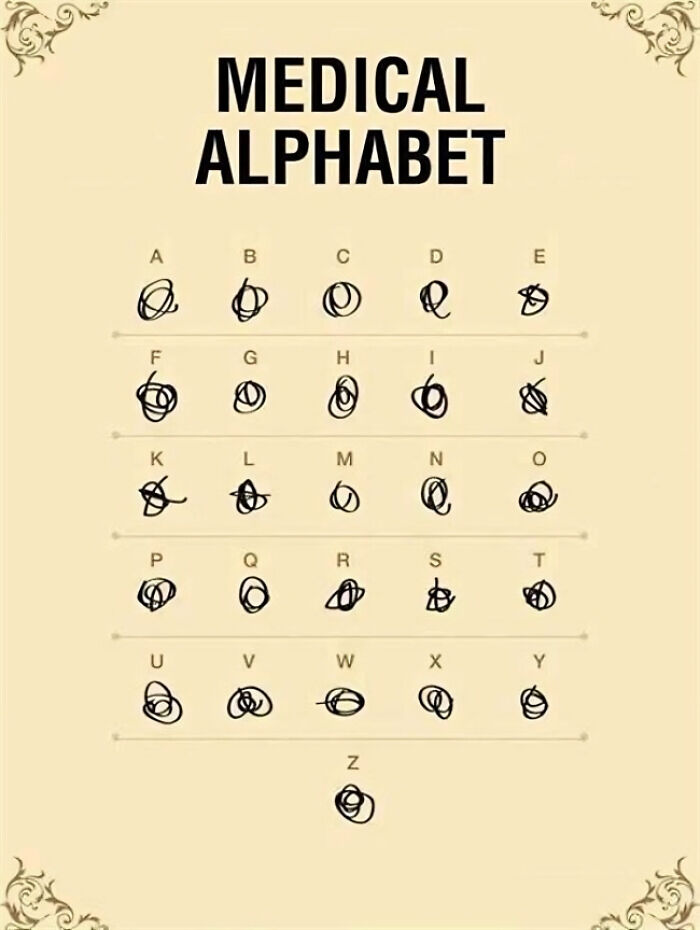
Image credits: oopsicharted
#14 Why My Heart Is Racing
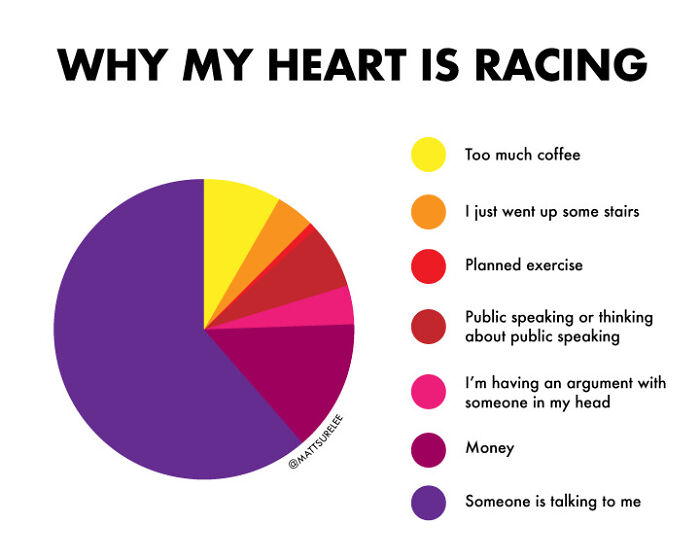
Image credits: matts41
#15 A Guide To Eating Fish At Work
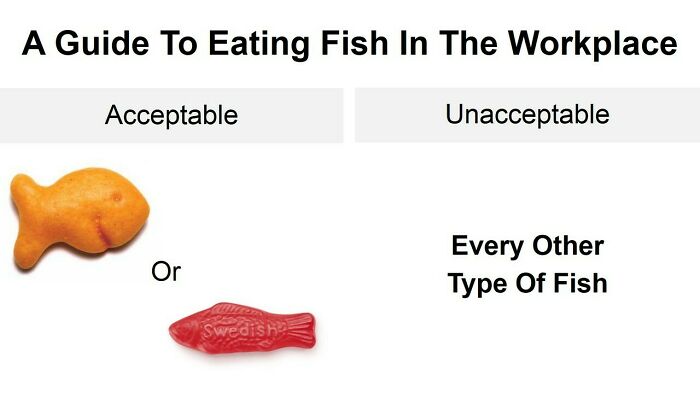
Image credits: oopsicharted
#16 How Men Shower
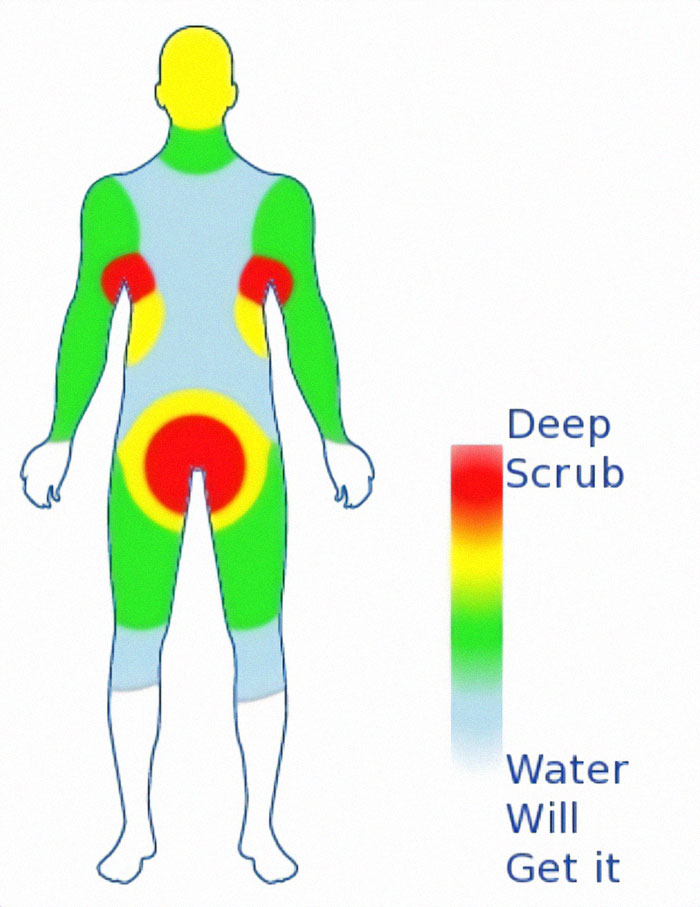
Image credits: matts41
#17 How To Calm Down
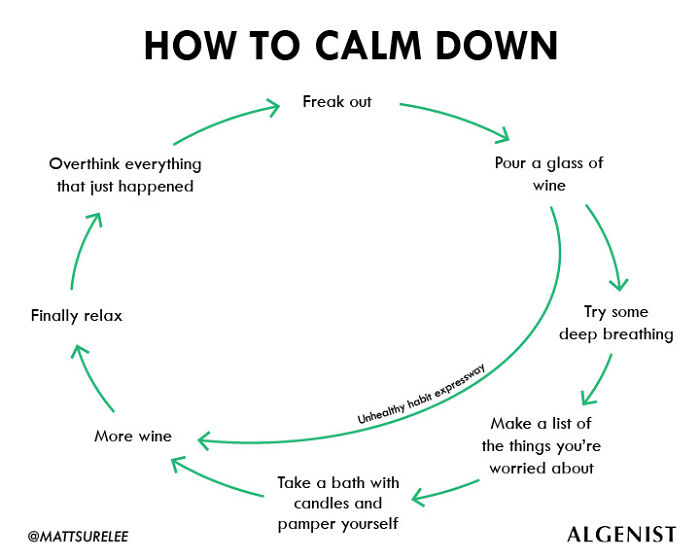
Image credits: matts41
#18 Maslow’s Hierarchy Of Basic Human Needs
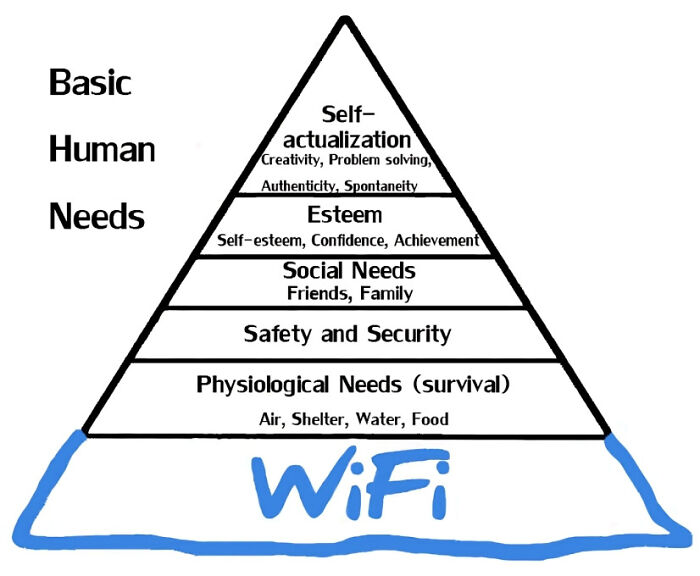
Image credits: matts41
#19 Cleaning The House
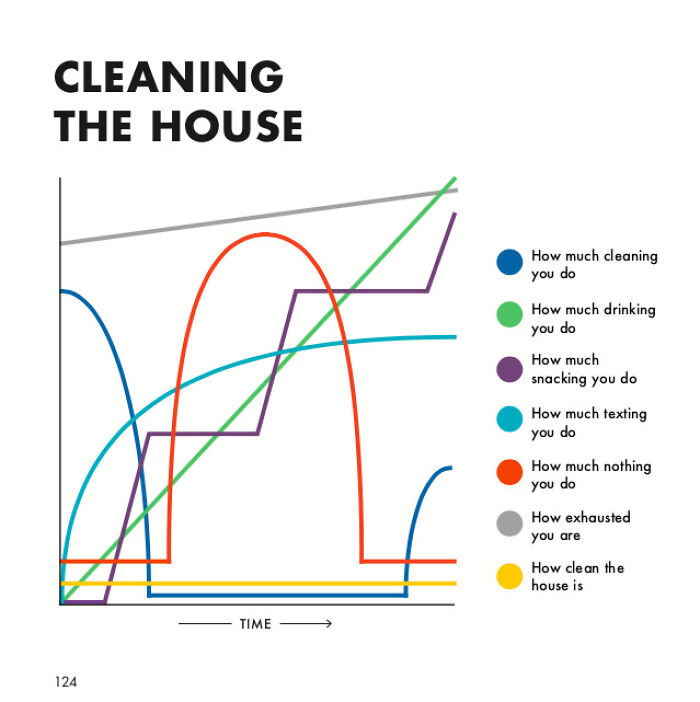
Image credits: matts41
#20 Falling Asleep Timeline
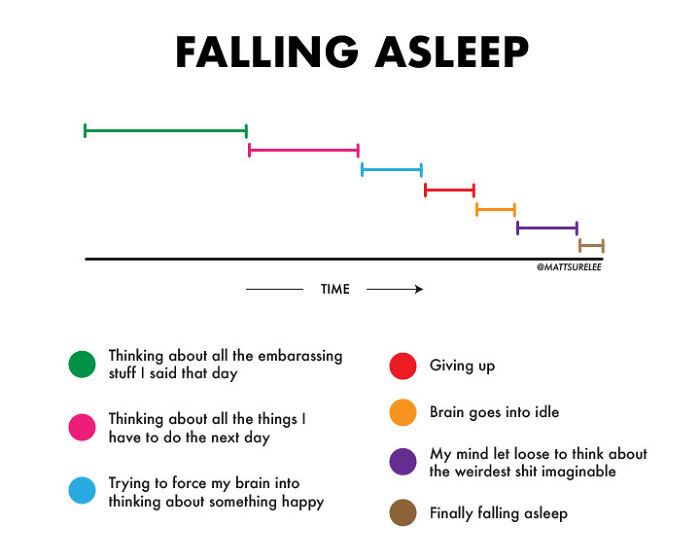
Image credits: matts41
#21 Annoying Modes Of Transportation
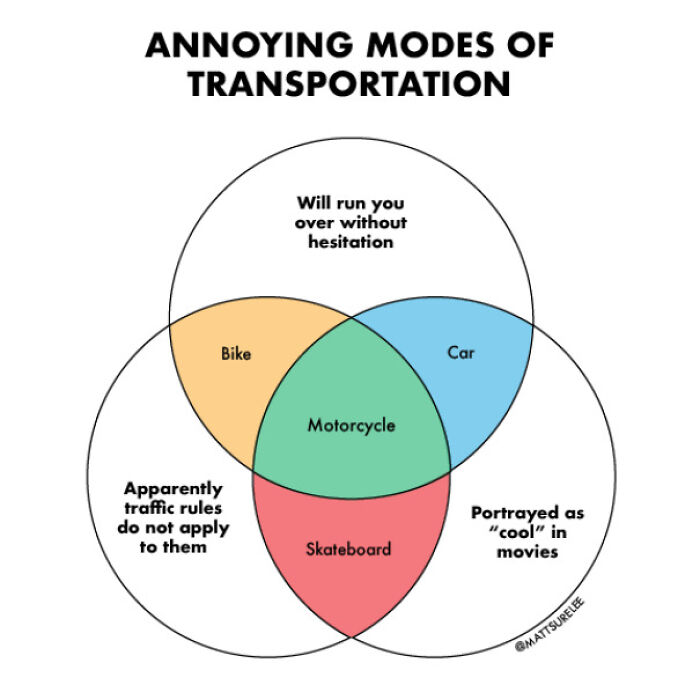
Image credits: matts41
#22 Writing An Email
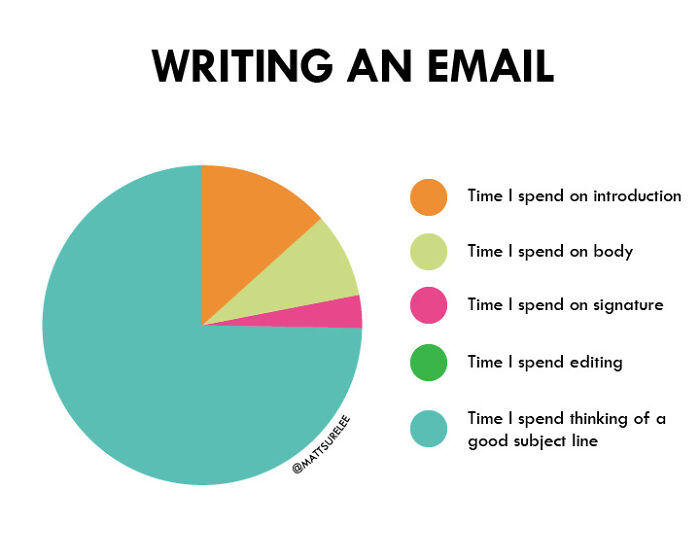
Image credits: matts41
#23 Playing Monopoly
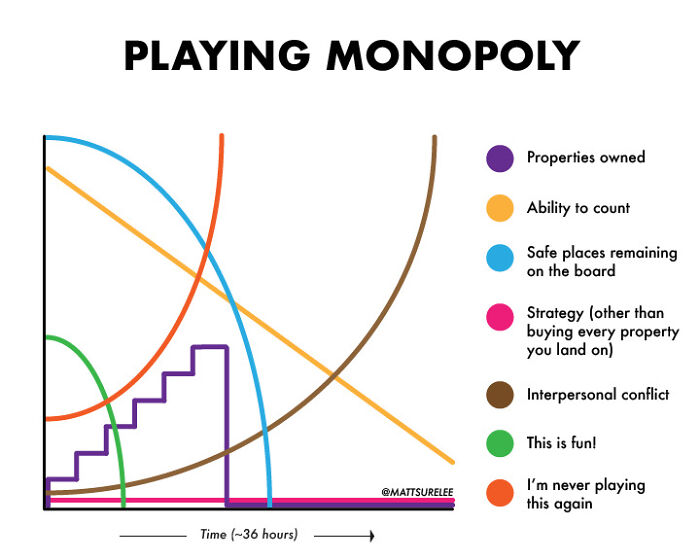
Image credits: matts41
#24 Is The Rest Of The World Even Trying?
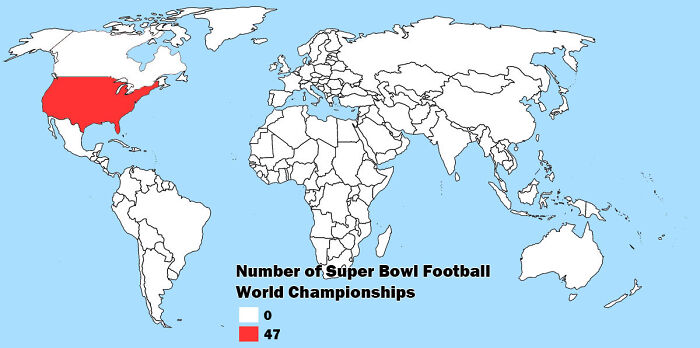
Image credits: matts41
#25 How To Turn Off A Ceiling Fan
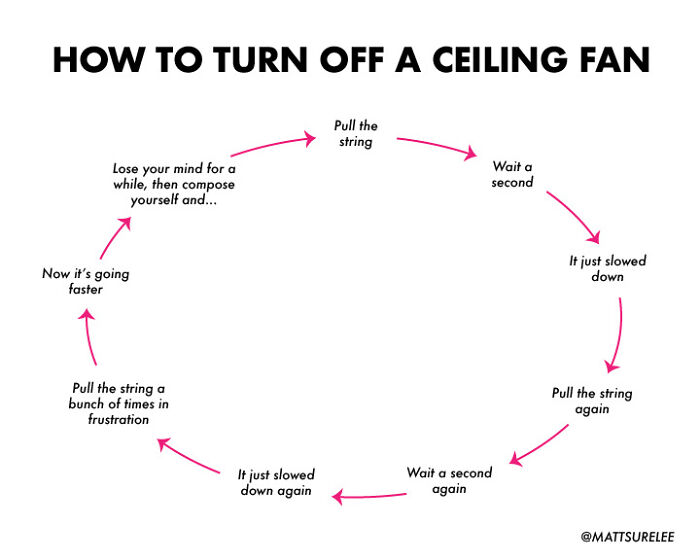
Image credits: matts41
#26 Getting Out Of A Meeting Excuse Generator
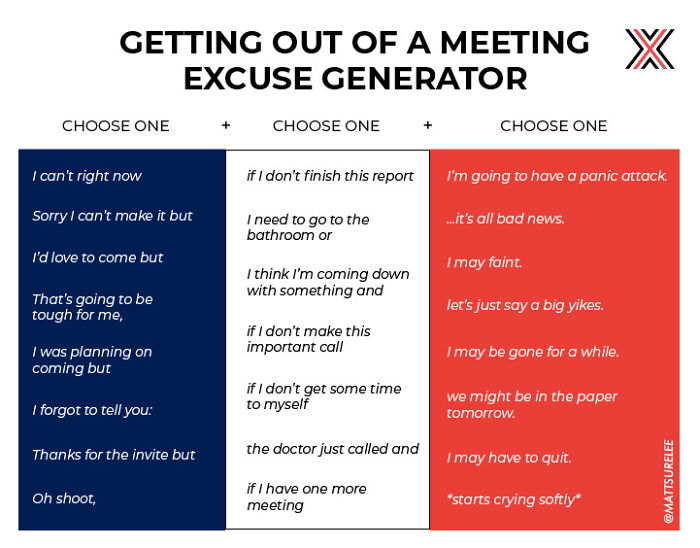
Image credits: matts41
#27 Canadian Chart
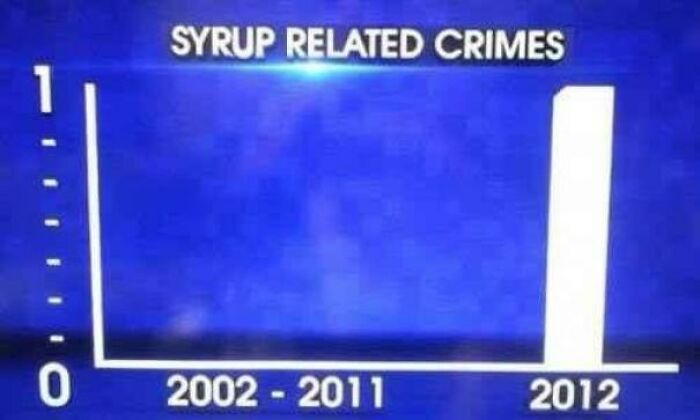
Image credits: matts41
#28 On An Airplane
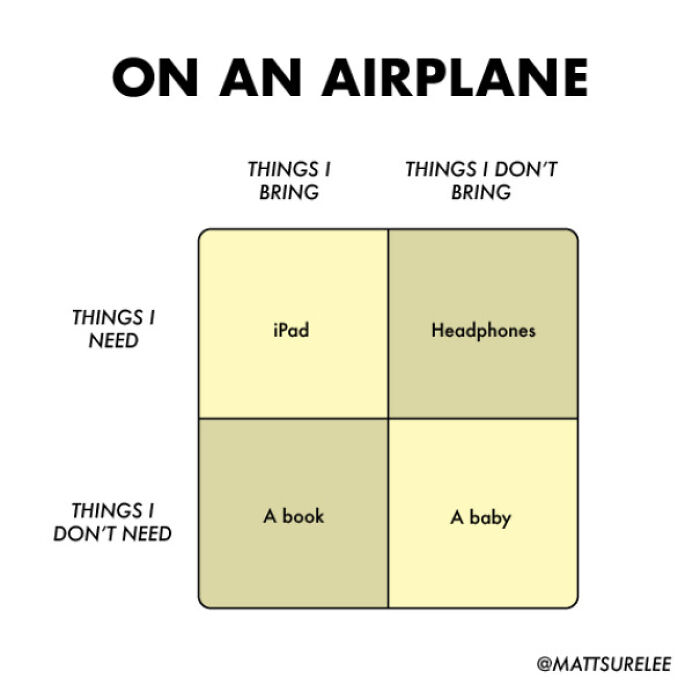
Image credits: matts41
#29 What People Say When They Try On Your Glasses
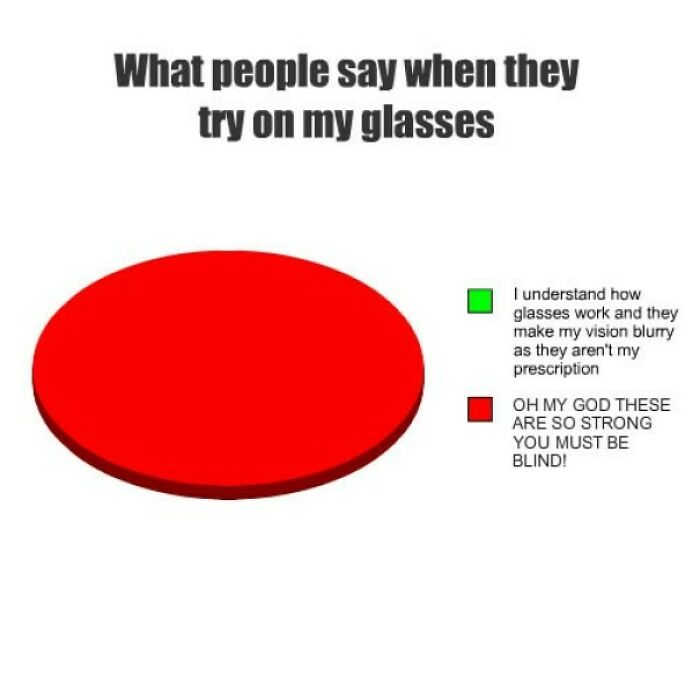
Image credits: matts41
#30 Greek Mythology Problems
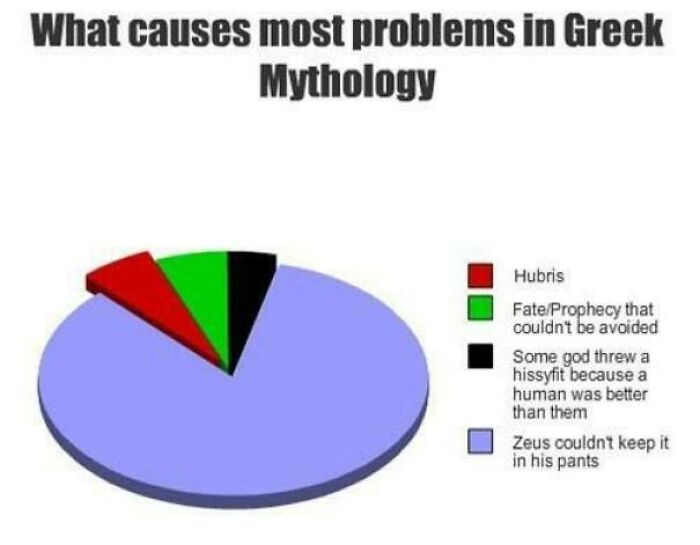
Image credits: oopsicharted
#31 Graduation Timeline
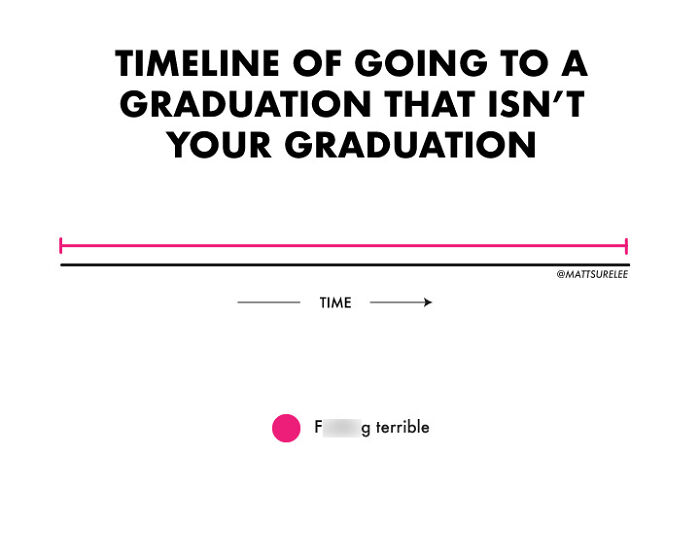
Image credits: matts41
#32 Yearly Flossing Calendar
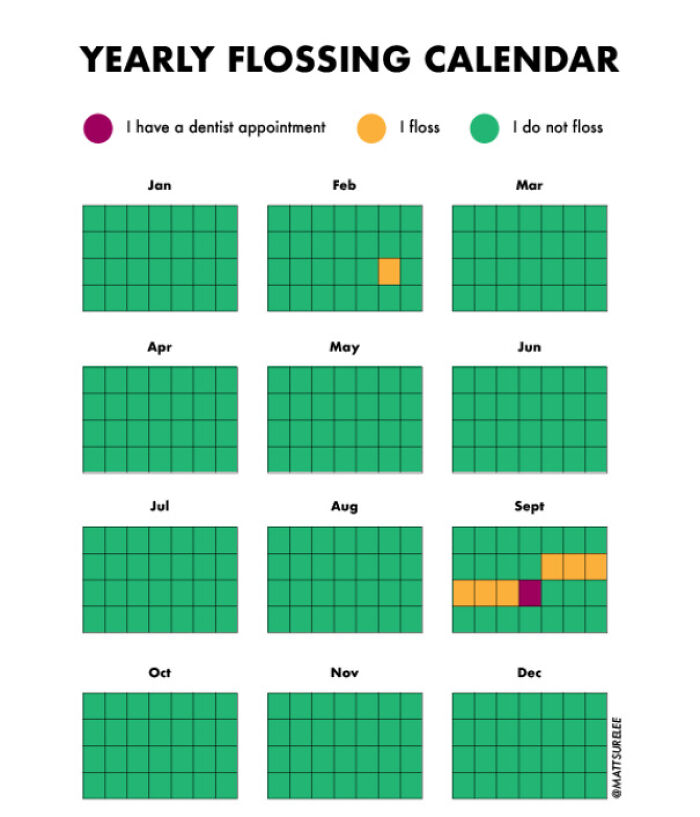
Image credits: matts41
#33 Moving A Picture In Word
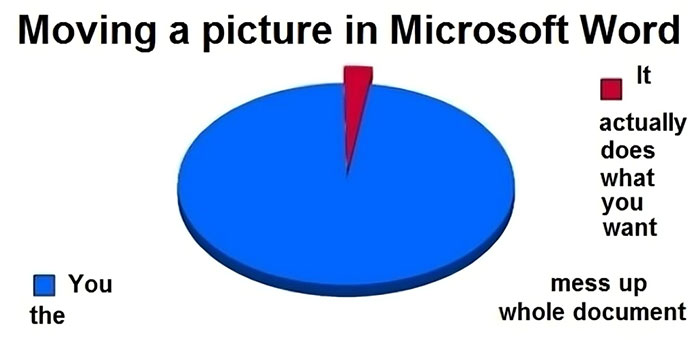
Image credits: matts41
#34 Frequency Of Miracles
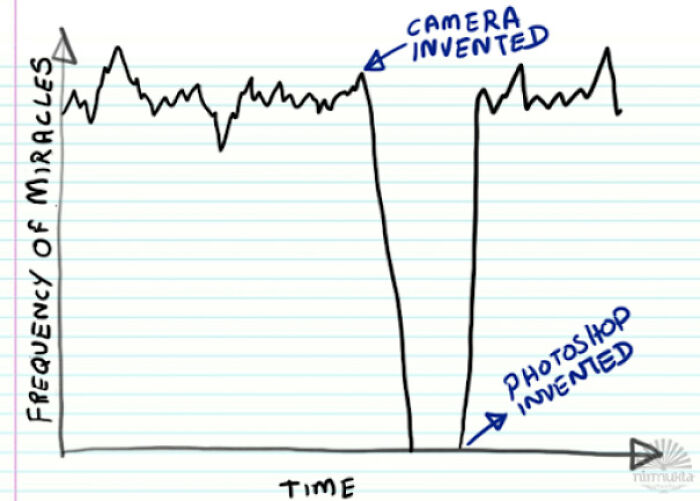
Image credits: oopsicharted
#35 High School Science Class
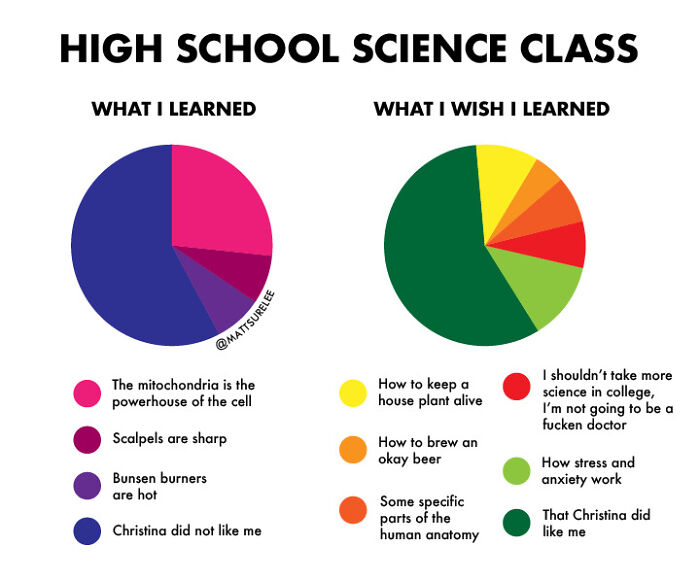
Image credits: matts41
#36 When People Find A Paperclip
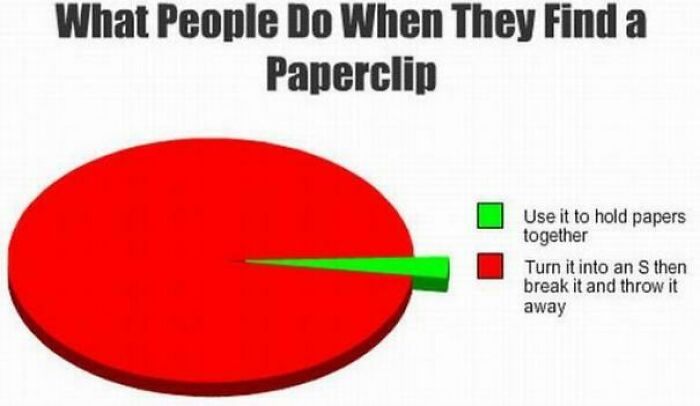
Image credits: i_noticed_you
#37 Getting A Package (Choose 2)
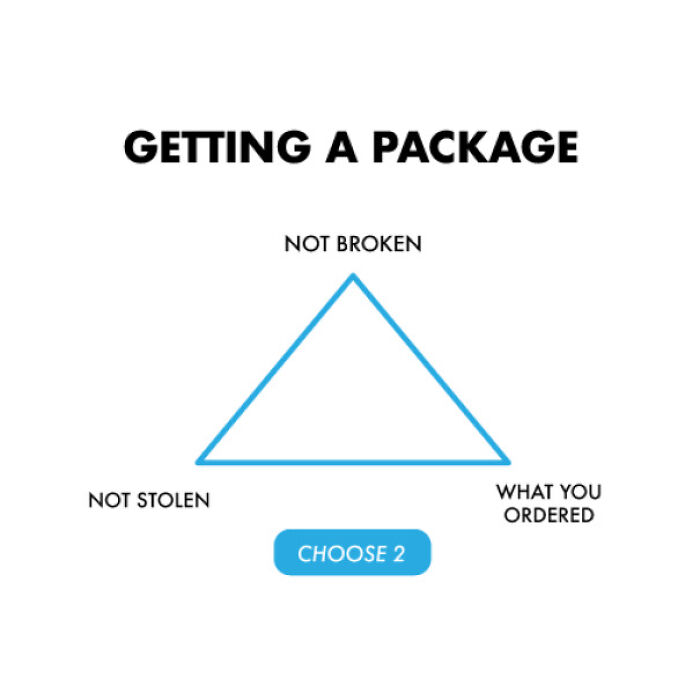
Image credits: matts41
#38 Things That Help Me Sleep
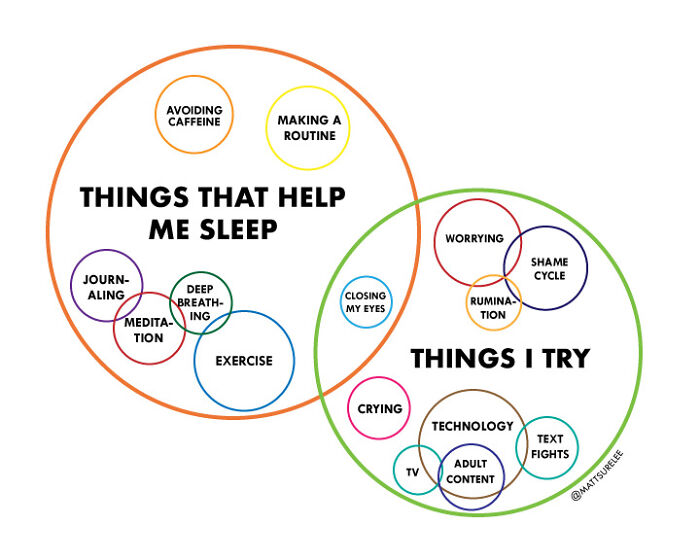
Image credits: matts41
#39 What Everybody Is Doing
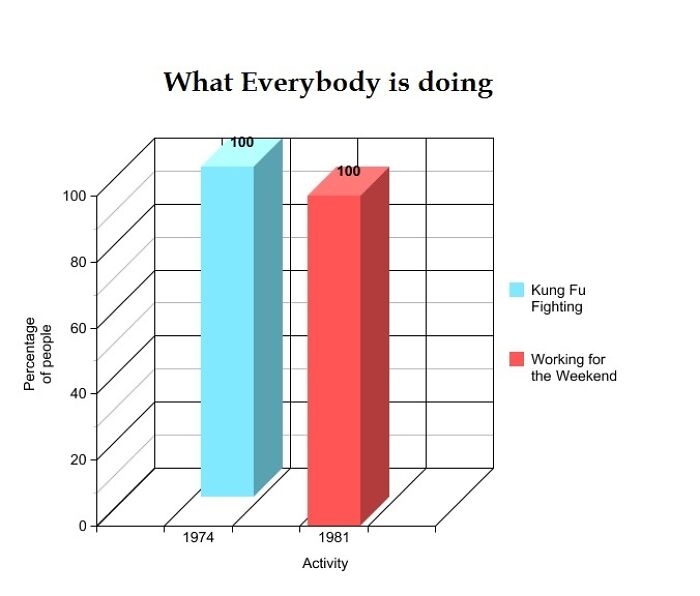
Image credits: matts41
#40 Temperatures In The Us This Week
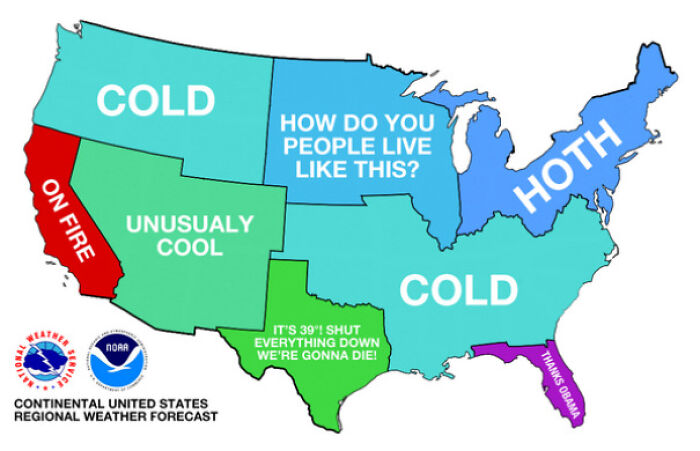
Image credits: matts41
#41 Driving Home From A Date
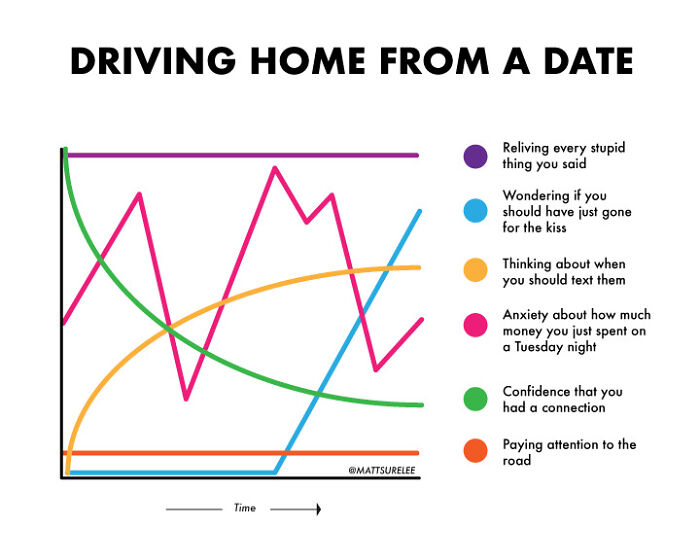
Image credits: matts41
#42 Updated March Schedule
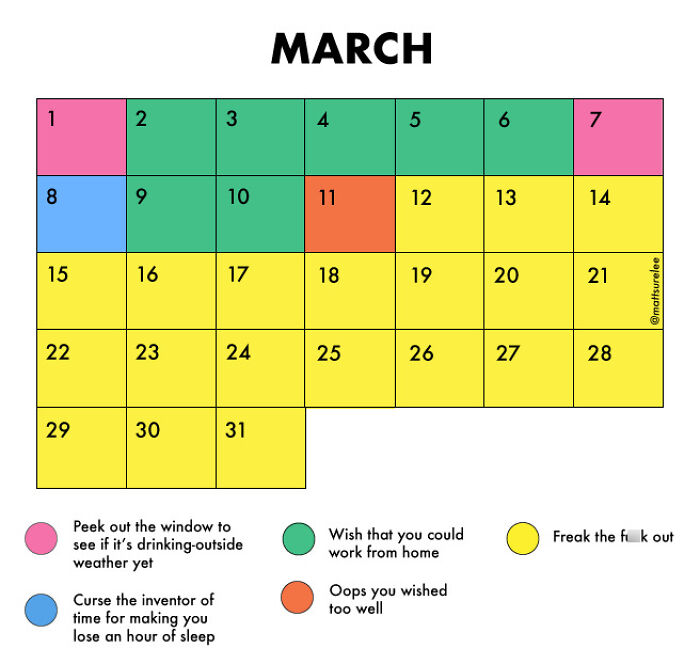
Image credits: matts41
#43 Get Your S**t Together W
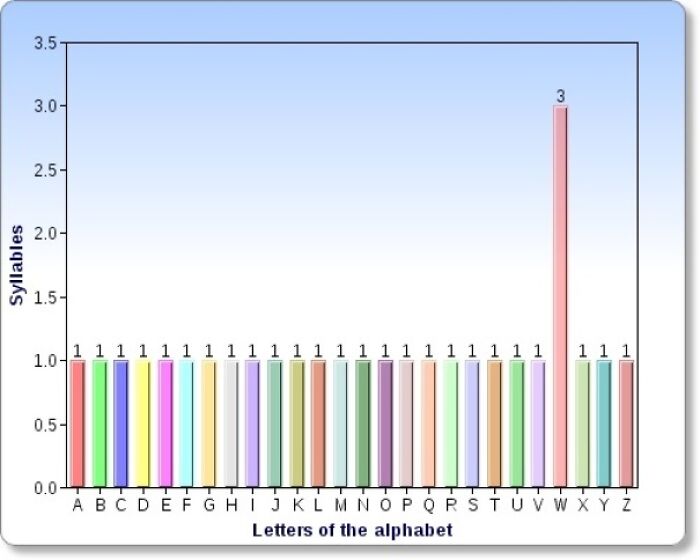
Image credits: matts41
#44 Anatomy Of Songs
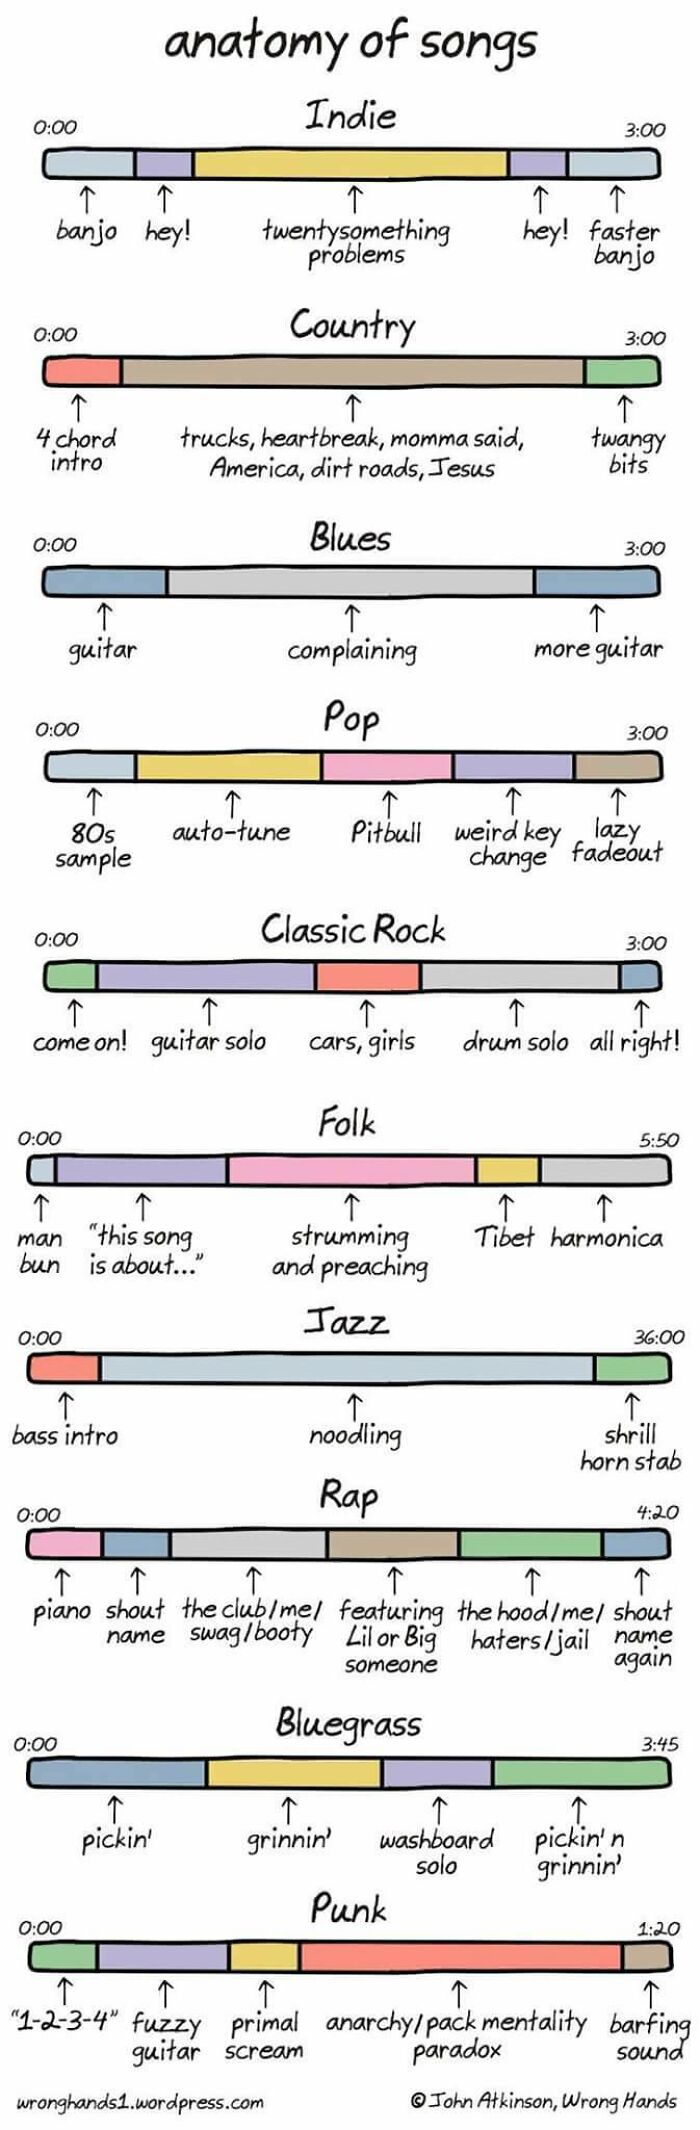
Image credits: matts41
#45 Zoom Call Timeline
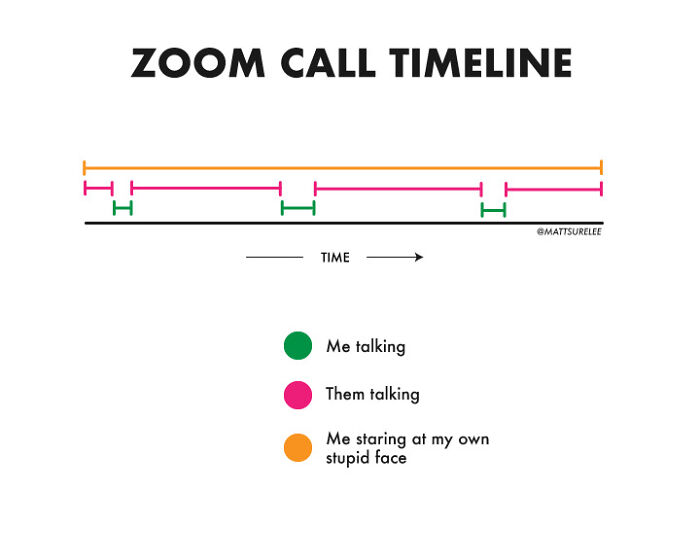
Image credits: matts41
#46 Confusing To Every American
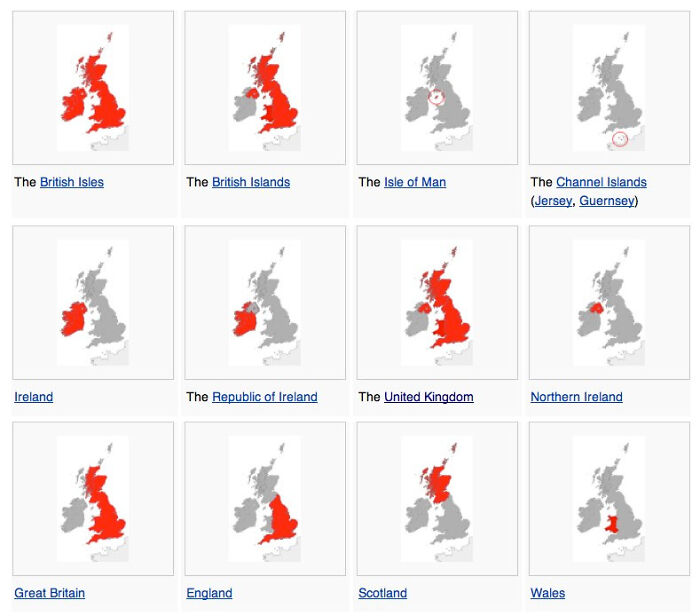
Image credits: oopsicharted
#47 Breaking Up vs. Getting Broken Up With
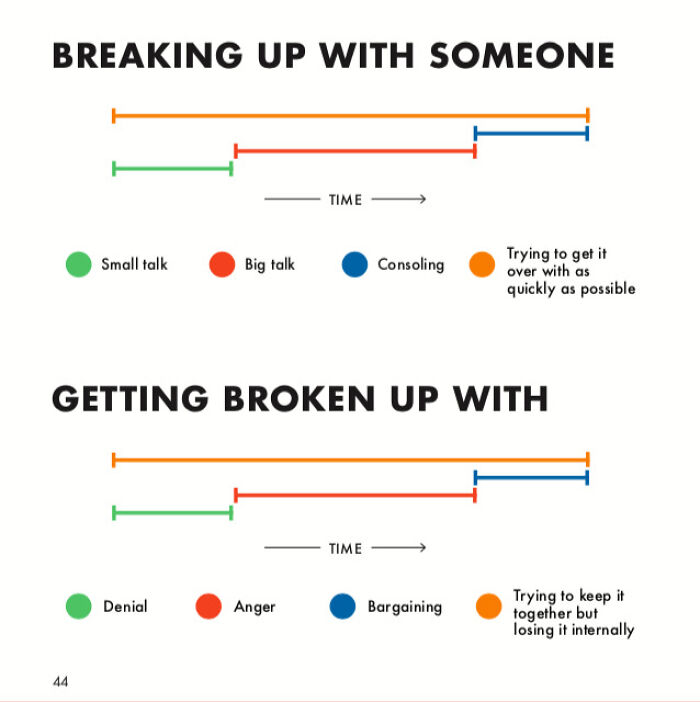
Image credits: matts41
#48 Australia (As Labeled By A Brit)
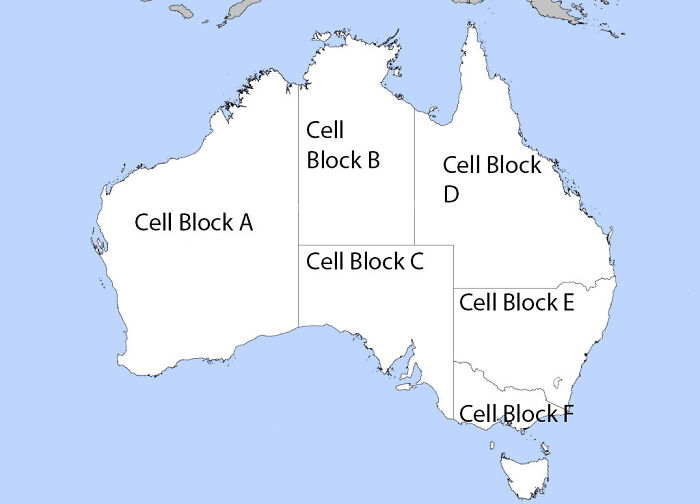
Image credits: matts41
#49 Reasons Apps Crash
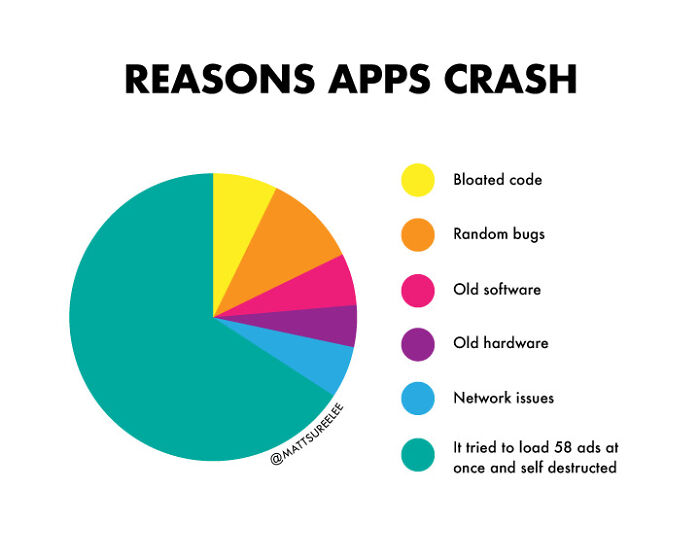
Image credits: matts41
#50 Christmas Day
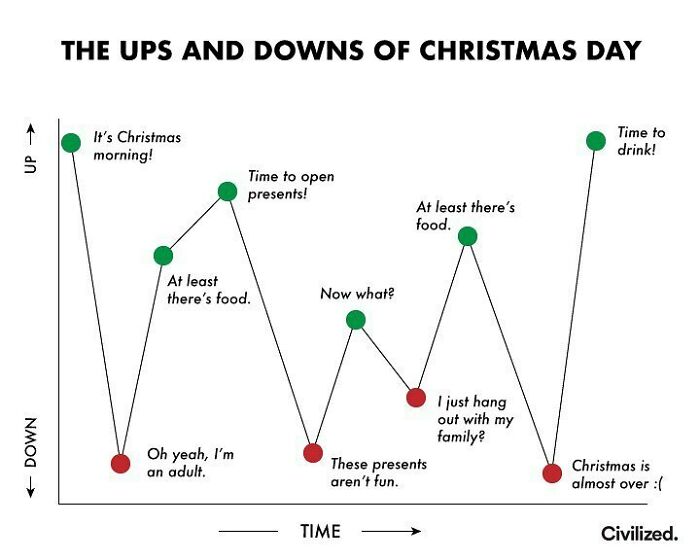
Image credits: matts41
#51 Every Bowling Alley Ever
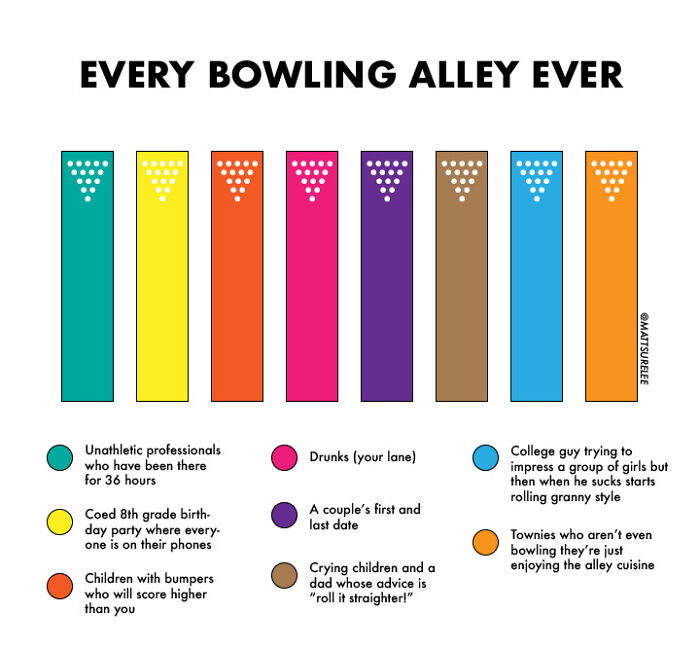
Image credits: matts41
#52 How Long Minutes Feel
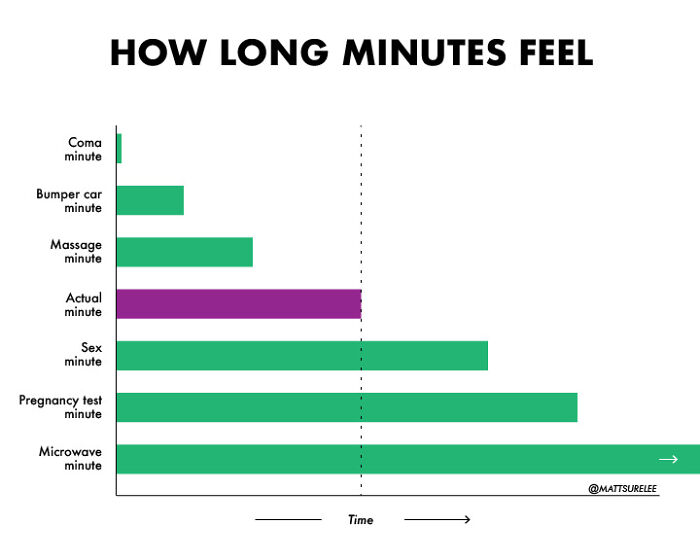
Image credits: matts41
#53 Leaving A Message
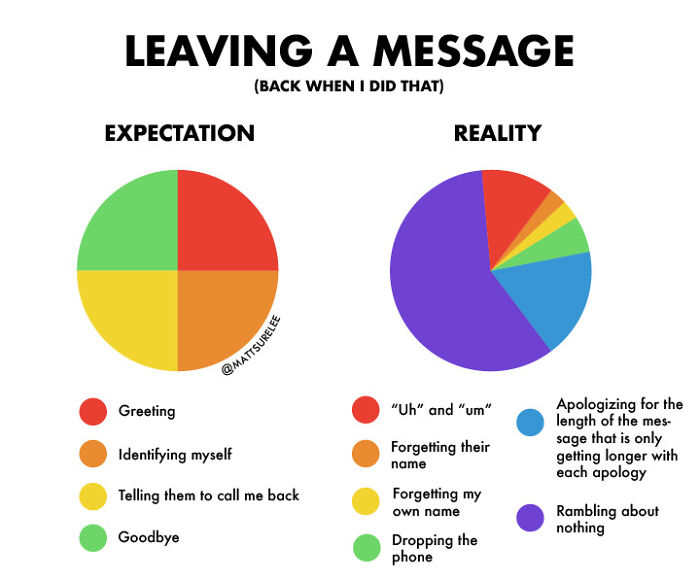
Image credits: matts41
#54 Why Not To Grow A Beard
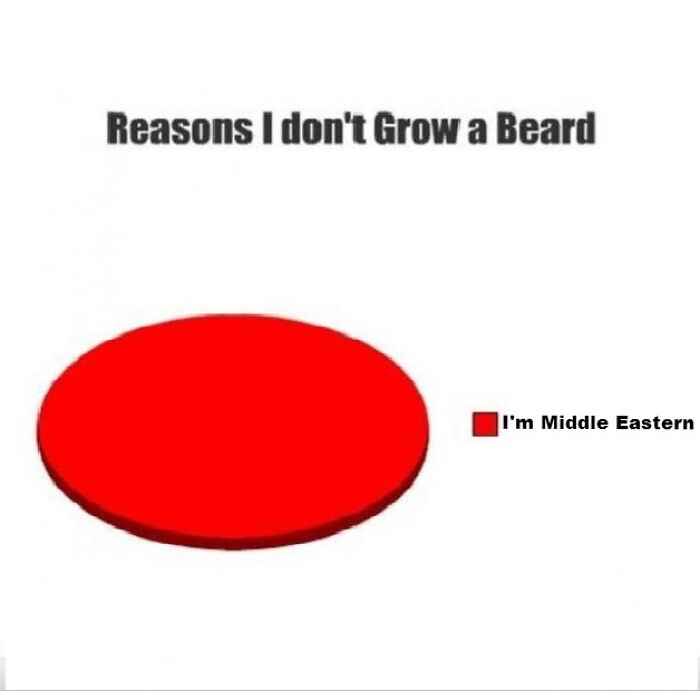
Image credits: oopsicharted
#55 How Society Views Sleeping

Image credits: matts41
#56 Things To Release At A Wedding
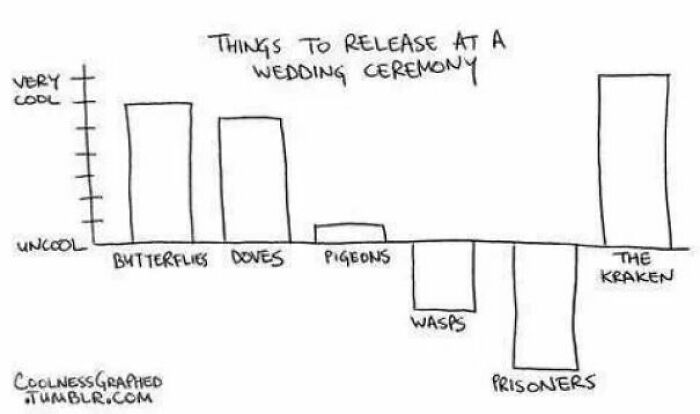
Image credits: matts41
#57 Drunk Driving
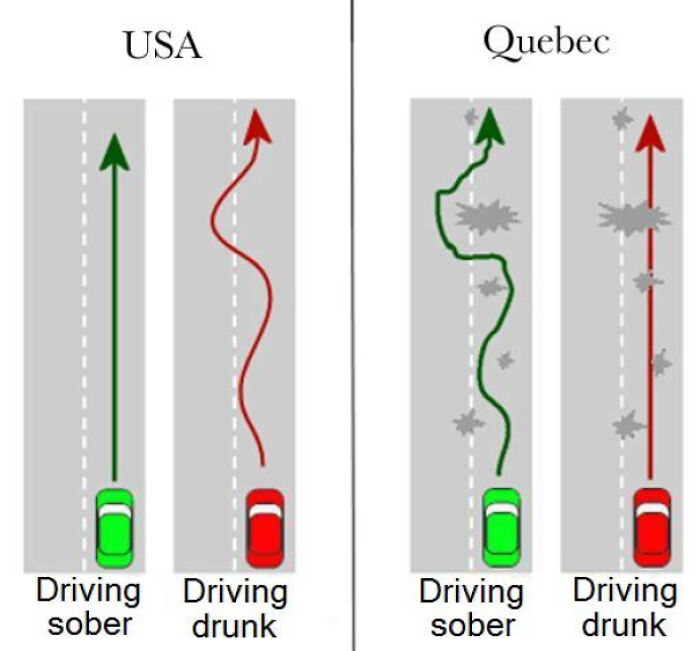
Image credits: matts41
#58 Why I Take The Stairs
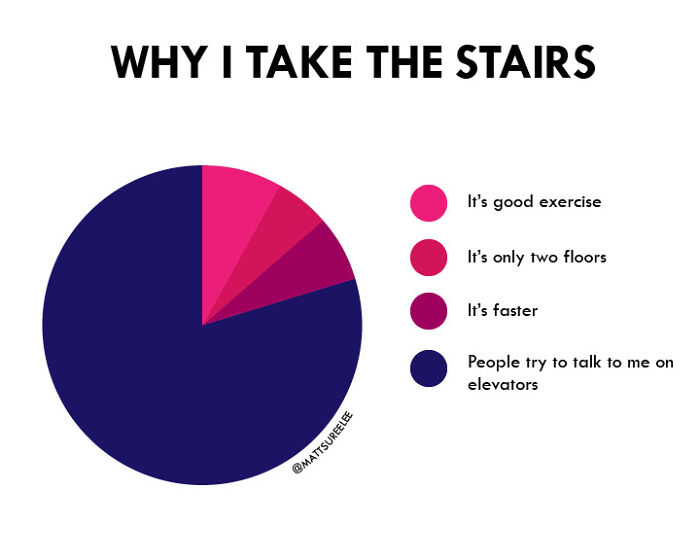
Image credits: matts41
#59 Venn Diagrams
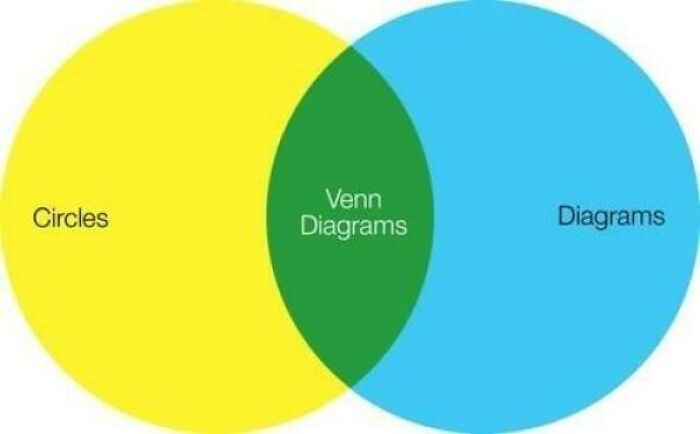
Image credits: matts41
#60 Reasons To Like France
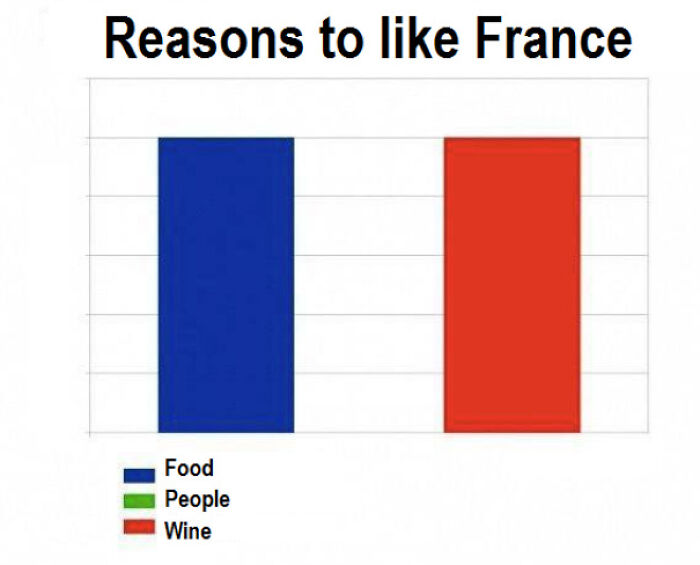
Image credits: medwii
from Bored Panda https://ift.tt/Ch8wrmT
via IFTTT source site : boredpanda